▣The problem: ideas without an operating system
Cost and design improvement ideas existed across bagging, filling, delivery, and peripheral platforms, but without a shared intake, triage, gate, and financial validation path they stayed tribal. Leadership needed opportunity versus recognized savings—and a single owner who would fund, track, and communicate the portfolio.
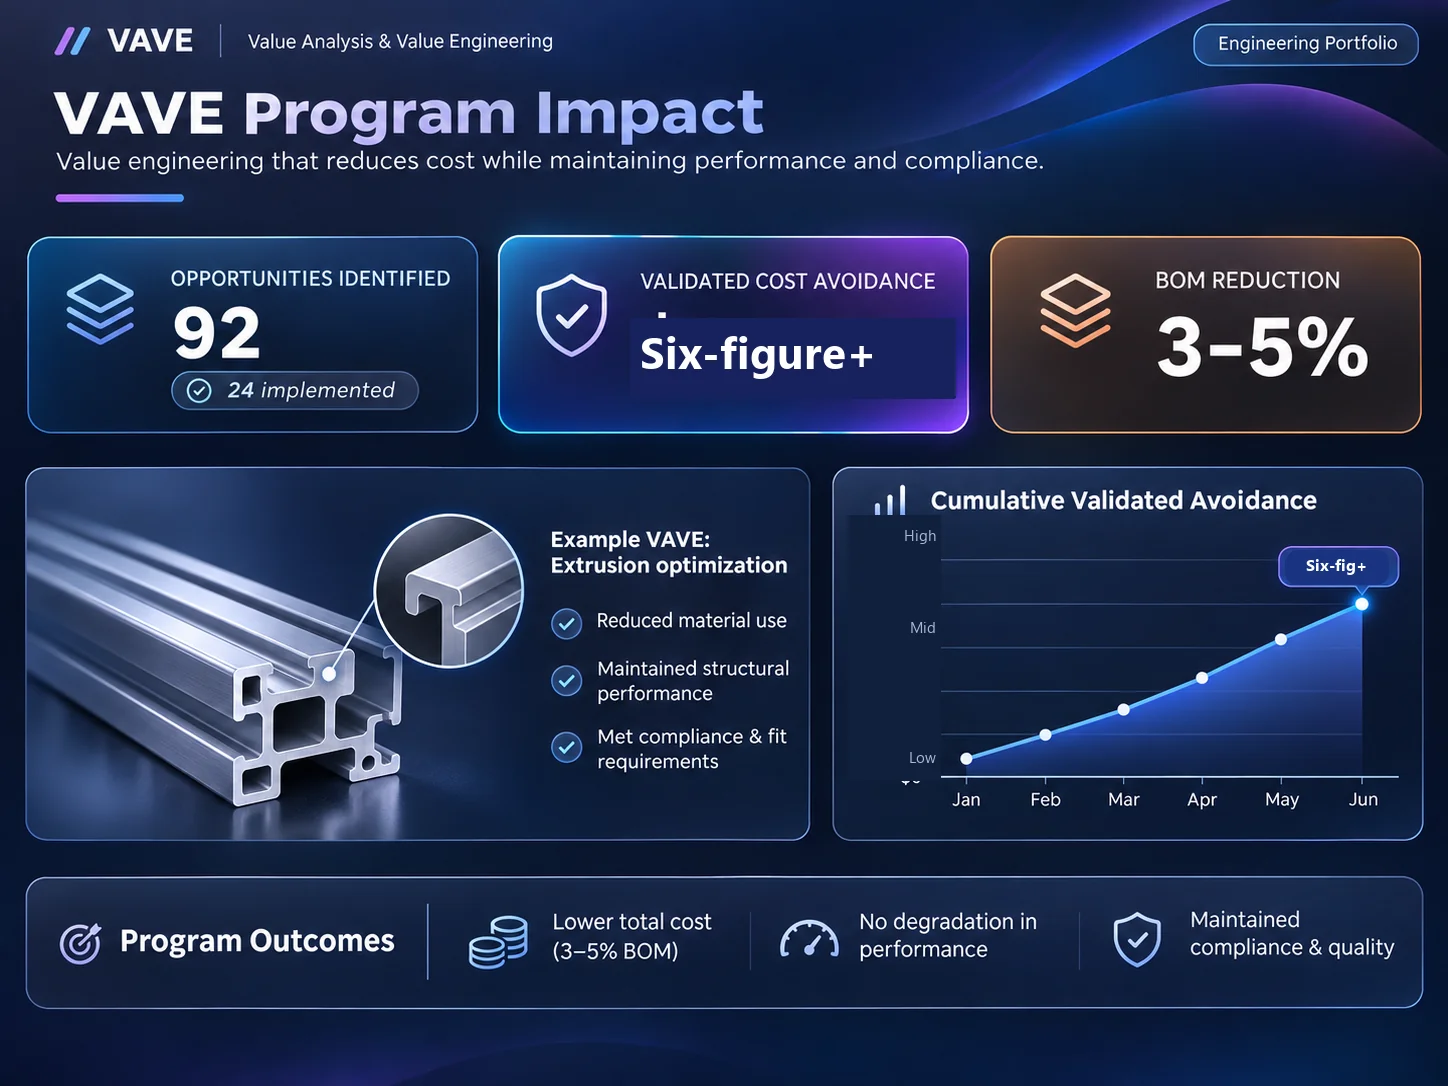
I created, built, and operationalized the R&D-wide VAVE program end-to-end with no separate oversight layer: intake through gates, implementation tracking, stakeholder communication to Director/VP audiences, and the live dashboard. I managed 92 opportunities, implemented 24 initiatives, and delivered validated cost avoidance with 3–5% BOM cost reductions on delivered work.
◇What I stood up
The system runs as a lightweight operating model tuned for iA: value analysis on released products, typically initiated from operations/engineering, with a bias to few high-certainty wins.
- Intake form and Opportunity Register
- Weighted prioritization (finance, cost/DFx — DFM·DFA·DFR, customer pressure, effort)
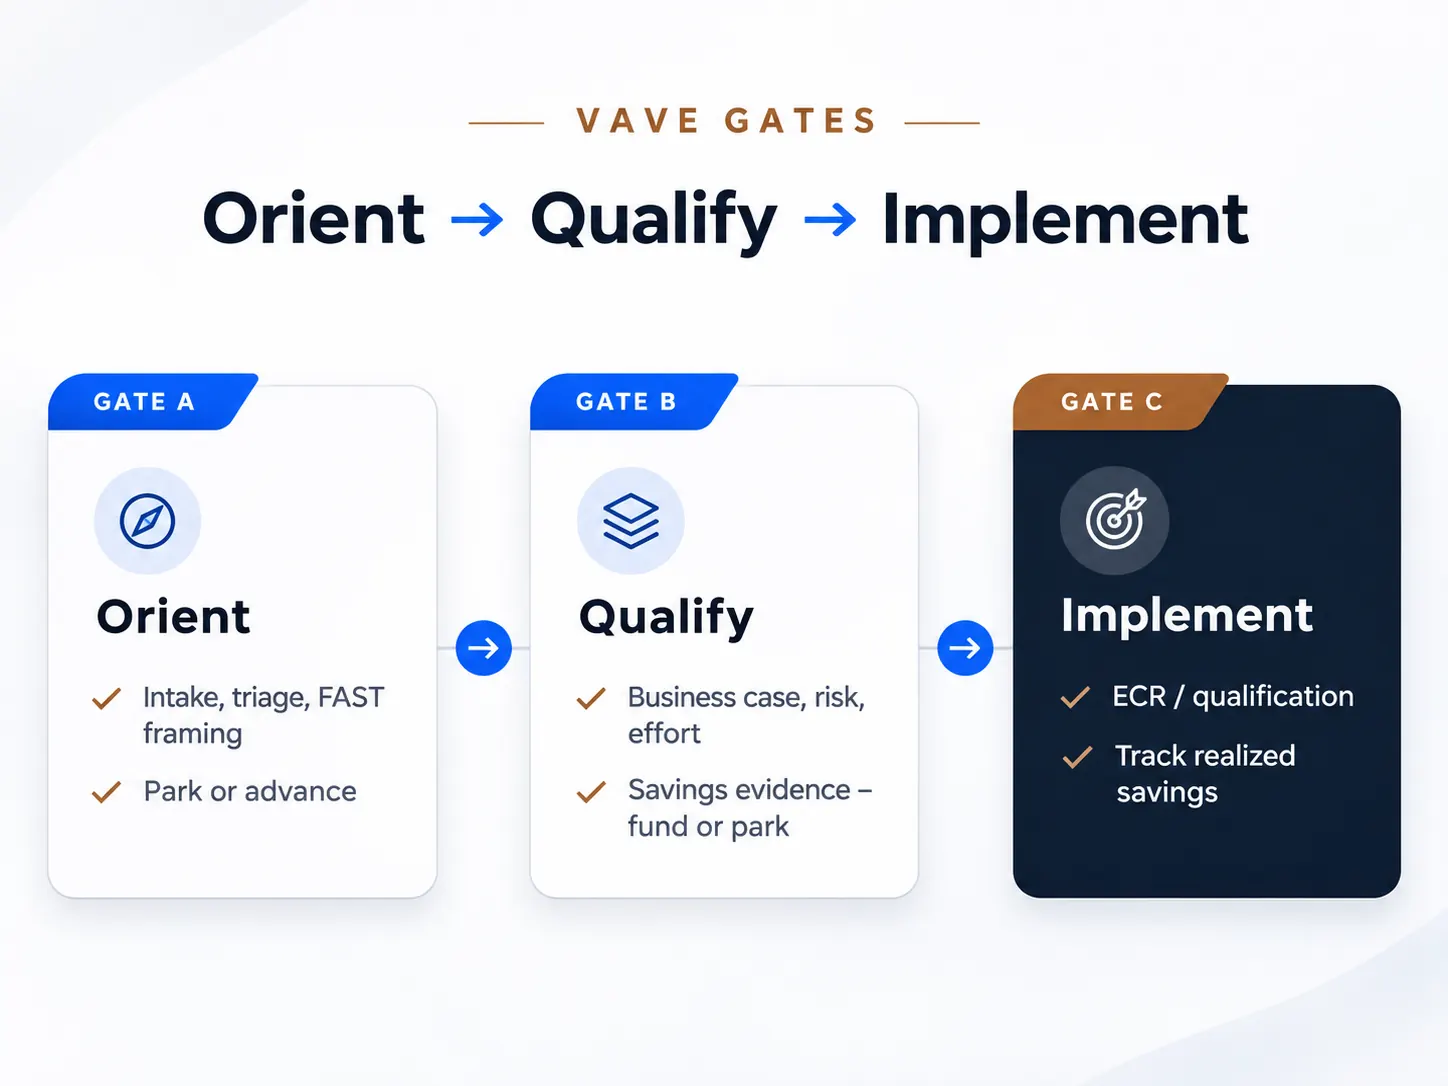
- Three-gate cycle (Orientation → Qualify → Implement)
- Weekly stand-ups, monthly committee, quarterly backlog refresh
- RACI across PM, design eng, manufacturing/CI, finance, QA
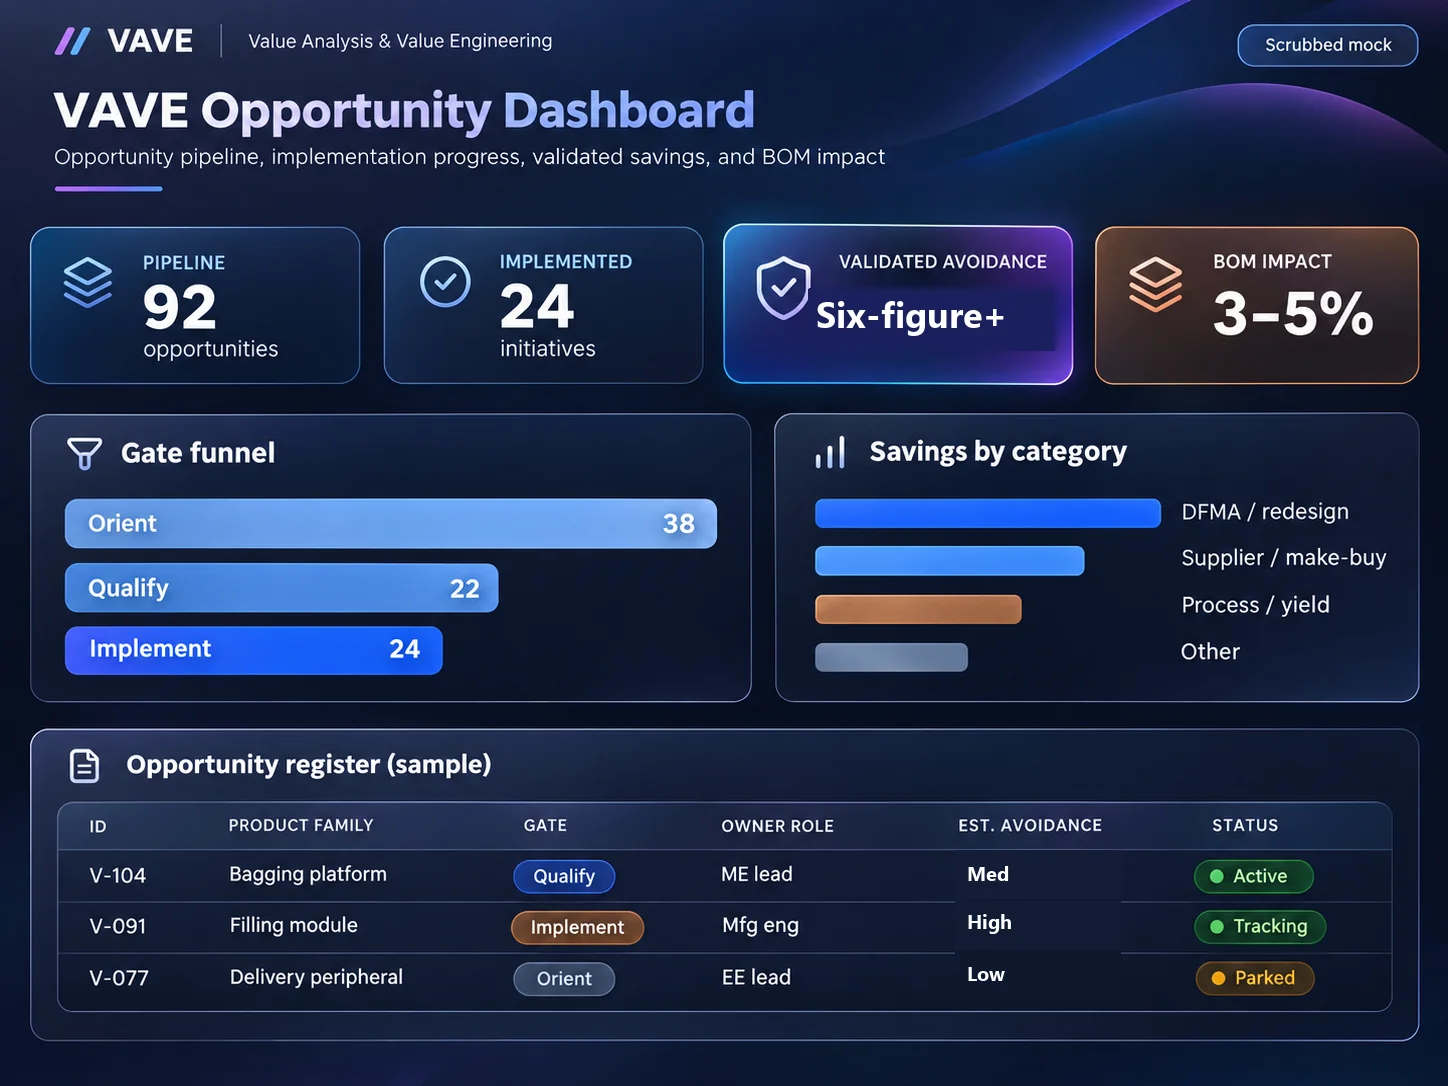
- Smartsheet scorecard/dashboard for pipeline and ROI
◎Build to scale, then refine to scale
The first useful version was an Excel pilot—enough to prove intake, prioritization, and savings tracking. That refined into a live Smartsheet system once the process had users. When relational reporting and weekly automation hit spreadsheet limits, I productized it as an internal hosted VAVE Program Hub with automated weekly updates and report-outs for roughly 7–15 stakeholders.
Same operating model, successive surfaces: each step kept what worked and scaled the layer that was breaking. Program outcomes: 92 opportunities managed, 24 initiatives implemented, validated cost avoidance, and 3–5% BOM cost reductions on delivered work.
Tradeoffs and judgment calls
Build to scale—don’t wait for perfect tooling. Excel was enough to start. Refining to Smartsheet, then to a hosted Hub, kept adoption ahead of architecture vanity.
Own the full stack. I prioritized what to fund, tracked implementation, and communicated portfolio health directly—intake → gate → implement → validate savings—without a separate oversight office sitting on top of the work.
Fund what clears; park what cannot—without killing ideation. Gate criteria (time-to-realize, savings threshold, limited active candidates) kept capacity honest. Parking-lot and next-opportunity lanes kept ideas visible; only gated work consumed engineering bandwidth.
Automate the report-out. Weekly automation meant 7–15 stakeholders could stay current without hand-building status every cycle—refine the process until the tool carries the load.
Tools & operating systems I put in place
From register and gates to a hosted tool people actually used.
Intake + Opportunity Register
Structured backlog with product, cost delta, risk, and owner—not chat threads.
Gate A / B / C cycle
Orientation → qualify with evidence → implement/ECR, with governance light enough to run.
VAVE Program Hub
Excel → Smartsheet → hosted tool; weekly automation for ~7–15 stakeholders.
Cadence & RACI
Stand-ups, committee, and quarterly refresh across PM, design, MFG/CI, finance, QA.